- Home
- AI Solutions
- Attention Map & Full Analysis
Attention Map
Attention Map & Full Analysis
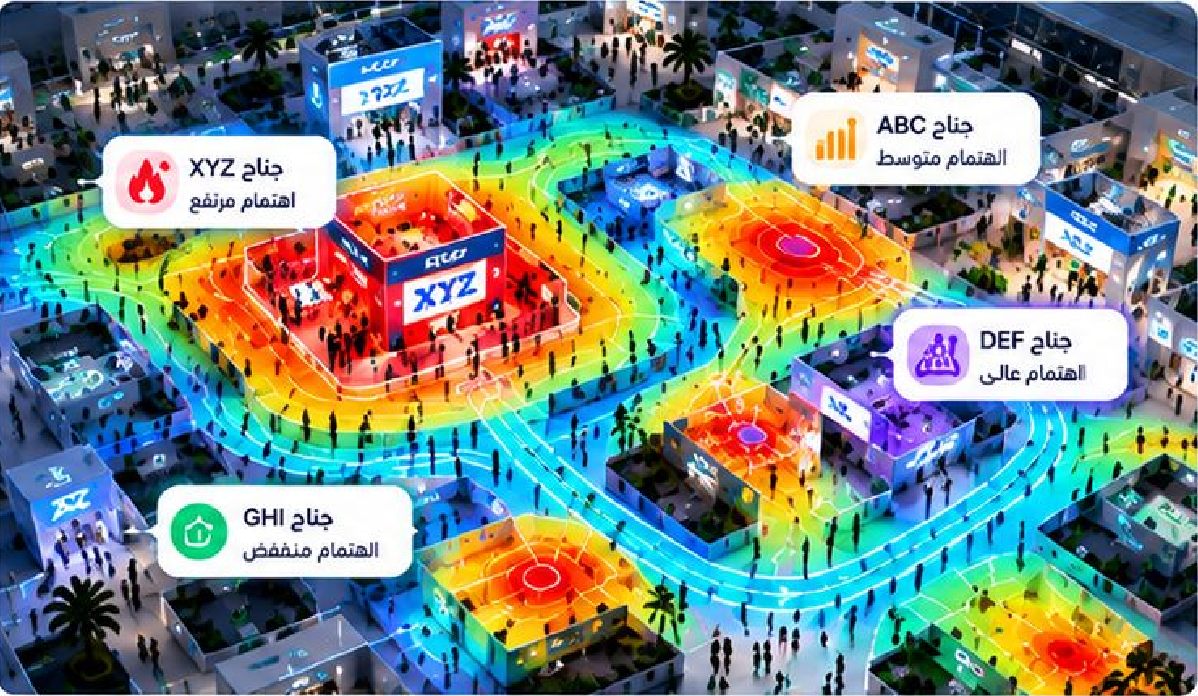
More than a heatmap — a complete picture of visitor behavior, movement and engagement
The AI attention map measures attraction zones, behavior details, dwell time, movement directions and actual engagement inside the exhibition — delivering precise insights for data-driven improvement decisions.
- 18,542Total visitors
- 4.6Avg. stop time (min)
- 68%Engagement level
- 12Main attraction zones
Illustrative dashboard figures — actual results depend on each event.
Analysis Tools
Heatmap
Where visitors gather most.
Movement Directions
Visitor flow and direction across the venue.
Dwell Time
How long visitors stop in each area.
Attention Zones
Interest analysis per booth.
Visitor Interactions
Visits and interactions in each zone.
Period Comparison
Before, during and after — side by side.
Visitor Segmentation
Behavior by visitor category.
Advanced Filters
Slice the data any way you need.
Multi-Layer Analysis
- Attention level
- Movement directions
- Stop zones
- Common paths
- Interaction zones
- Recommendations to improve booth distribution
Every Event Has a Rhythm.Every Exhibition Deserves Intelligence.
Ready to Make Your Next Event Smarter?
