- Home
- AI Solutions
- Live Exhibition Analytics
Live Event Analytics
Live Exhibition Analytics
Moment-by-moment data monitoring for faster decisions and a better visitor experience
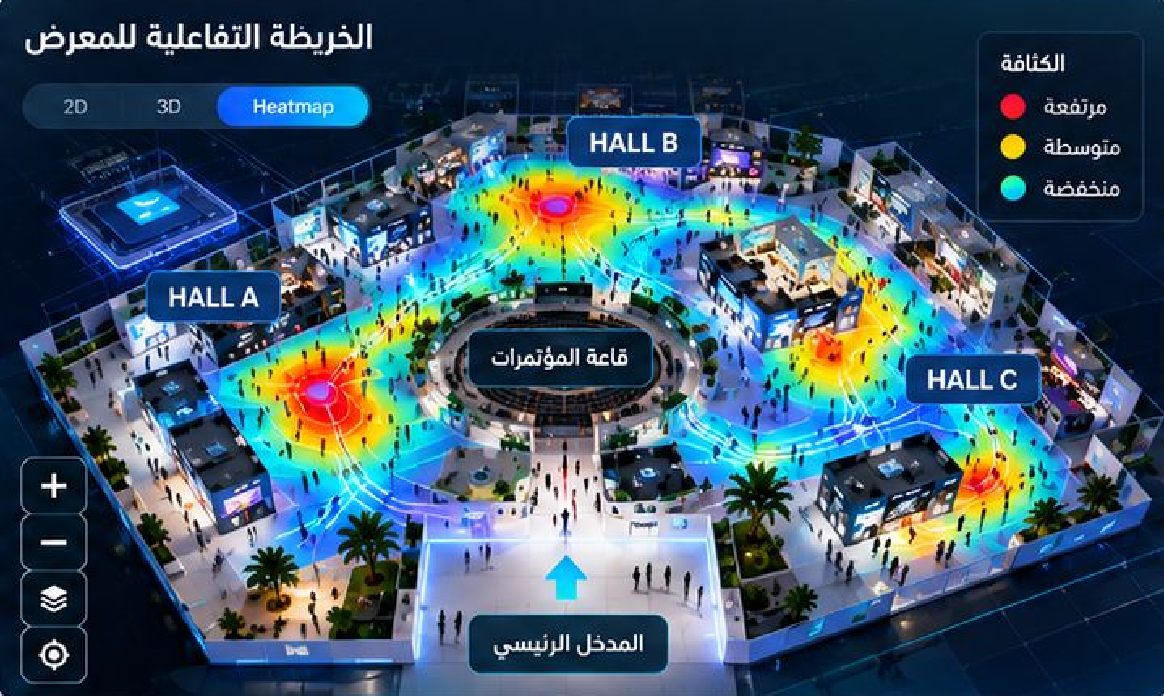
The platform provides a live dashboard showing visitor movement, density across zones, booth performance and the status of operational services in real time.
- 4,892Visitors now
- 640Entries per hour
- 28Avg. dwell (min)
- 78%Capacity used
Illustrative dashboard figures — actual results depend on each event.
Dashboard Views
Overview
All key indicators of the show on one screen.
Live Visitors
How many visitors are in the venue right now.
Heatmap
Density across halls and zones, live.
Visitor Flow
How visitors move between areas.
Booth Performance
Visits and engagement for each booth.
Sessions
Attendance and engagement in conferences and sessions.
Queues & Crowd
Waiting lines and crowded points.
Alerts
Instant notifications when something needs action.
Today's Key Indicators
Total Visitors
Compared with the previous day.
Most-Visited Booths
Which booths draw the crowds.
Average Engagement Time
How long visitors stay engaged.
Engagement Rate
The share of visitors who interact.
Instant Alerts — Examples
High congestion in Hall B
Recommend more guidance points and better entry management.
Longer registration queues
Average wait time reaches 12 minutes.
Lower movement in Hall A
Visitor numbers 30% below expectations.
Every Event Has a Rhythm.Every Exhibition Deserves Intelligence.
Ready to Make Your Next Event Smarter?
