- Home
- AI Solutions
- Visitor Journey Analysis
Visitor Journey Intelligence
Visitor Journey Analysis
Understand how visitors move through the exhibition and discover the most-used patterns and routes
We provide precise analysis of visitor routes across all zones and booths, identifying attraction points and drop-off points — helping improve the exhibition layout and the distribution of services and activities.
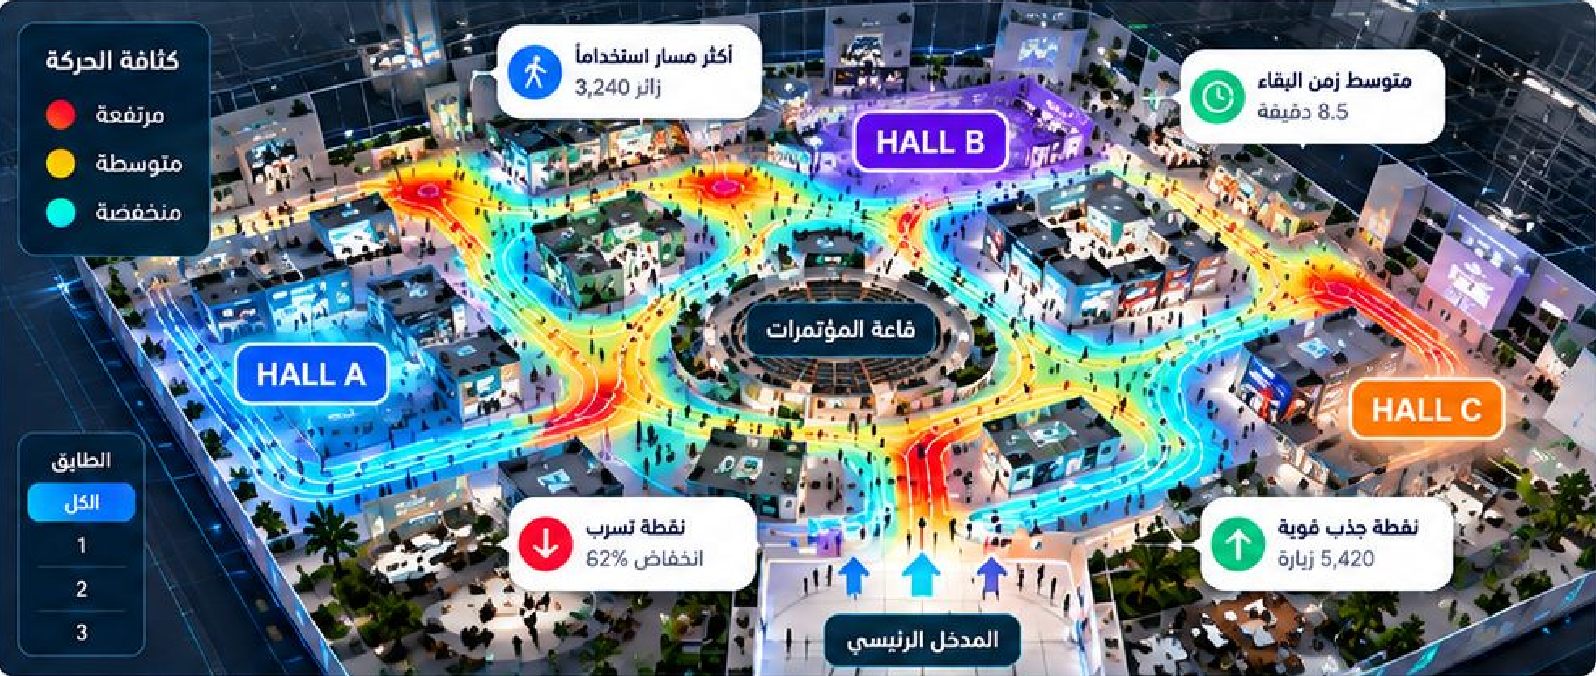
- 12,840Total visitor journeys
- 4.2Avg. zones per visitor
- 8.5Avg. time per booth (min)
- 27%Booth return rate
Illustrative dashboard figures — actual results depend on each event.
Visitor Route Examples
Most Common Route — 38% of visitors
Entrance → Hall A → Hall B → Conference Hall → Food Court → Exit
Tech-Interested Route — 26%
Entrance → Hall C → Tech Booths → Specialist Sessions → Startup Zone → Exit
Short Route — 18%
Entrance → Hall A → Selected Booths → Exit
Key Analysis Points
Main Routes
Most visitors pass through Hall A first.
Drop-Off Points
Movement drops between Hall B and Hall C.
Improvement Opportunities
Add signage and services in the least-visited zones.
A Better Visitor Experience
Guide visitors to more balanced routes.
What We Measure
- Movement density by zone
- Strong attraction points
- Drop-off points
- Dwell time per booth
- Most-visited booths
- Return visits
Every Event Has a Rhythm.Every Exhibition Deserves Intelligence.
Ready to Make Your Next Event Smarter?
